Inflation Report
January – March 2011
MAY 2011
January – March 2011
MAY 2011
BOARD OF GOVERNORS
Governor
AGUSTÍN GUILLERMO CARSTENS CARSTENS
Deputy Governors
ROBERTO DEL CUETO LEGASPI
MANUEL RAMOS FRANCIA
MANUEL SÁNCHEZ GONZÁLEZ
JOSÉ JULIÁN SIDAOUI DIB
Governor
AGUSTÍN GUILLERMO CARSTENS CARSTENS
Deputy Governors
ROBERTO DEL CUETO LEGASPI
MANUEL RAMOS FRANCIA
MANUEL SÁNCHEZ GONZÁLEZ
JOSÉ JULIÁN SIDAOUI DIB
INFLATION REPORT
This report analyzes the development of both inflation and the economy in Mexico, as well
as different domestic economic indicators, in compliance with Article 51, last section, of
Banco de México’s Law.
This report analyzes the development of both inflation and the economy in Mexico, as well
as different domestic economic indicators, in compliance with Article 51, last section, of
Banco de México’s Law.
FOREWARNING
This text is provided for the reader’s convenience only. Discrepancies may
possibly arise between the original document and its translation to English.
The original and unabridged Inflation Report in Spanish is the only official
document.
Unless otherwise stated, this document has been prepared using data
available as of May 9, 2011. Figures are preliminary and subject to changes.
CONTENTS
1. Introduction .......................................................................................................... 1
2. Recent Developments of Inflation ........................................................................ 3
2.1. Inflation………….. ..................................................................................... 3
2.2. Producer Price Index ................................................................................ 8
2.3. Wages………….…. .................................................................................. 9
3. Economic and Financial Environment ................................................................. 11
3.1. International Environment ........................................................................ 11
3.1.1. World Economic Activity .............................................................. 11
3.1.2. Commodity Prices ....................................................................... 13
3.1.3. World Inflation Trends ................................................................. 14
3.1.4. World Financial Markets .............................................................. 17
3.2. Developments in the Mexican Economy .................................................. 20
3.2.1. Economic Activity ........................................................................ 20
3.2.2. Financial Saving and Financing in Mexico .................................. 24
4. Monetary Policy and Inflation Determinants ........................................................ 28
5. Inflation Forecasts and Balance of Risks ............................................................ 45
Technical Chapter
Exchange Rate Pass-through to Prices ............................................................... 50
BOX
1. Analysis of Inflation Expectations based on Banco de México’s Survey............. 30
2. Phillips Curve and Slack Conditions in the Mexican Labor Market ..................... 38
INFLATION REPORT JANUARY - MARCH 2011
1. Introduction
The world economy continued its recovery in the first quarter of 2011, even though uncertainty about its prospects has increased. Economic growth in advanced economies was moderate due to the slow recovery of private demand, while emerging economies maintained a vigorous economic expansion.
Although at a slower pace than in the previous quarter, U.S. economic activity increased during the first quarter of 2011, with the strong expansion of the industrial production standing out. In turn, private consumption grew at a more moderate pace, affected by the increase in the price of fuels. In the labor market, the unemployment rate remained high, although certain signs of improvement were observed. Also, the housing market and its prospects remained stagnated. In this way, uncertainty still persists as to the sustainability of the economic recovery in the U.S. once the fiscal and monetary stimuli are withdrawn.
International commodity prices continued to show an upward trend in the first quarter of the year. Increases registered in the energy price quotes were noteworthy. This was a consequence of the rapid growth of emerging economies, which has increased the demand for such products. In addition to this, in the case of crude oil, the supply has been affected by political instability in the Middle East and North Africa.
In the major advanced economies, headline inflation and its short-term expectations registered an increase associated with the rebound of commodity prices. However, core inflation remained low, due to the excess of existing capacity and still weak conditions in the labor market. In turn, long-term inflation expectations remained anchored. The U.S. Federal Reserve announced that: a) next June it would conclude its program of net purchase of Treasury bonds, as it had been originally announced, and it would maintain its present policy of reinvestment of principal payments from its securities portfolio; b) it would regularly review the amount and the composition of its security holdings; and c) it expected that economic conditions would probably warrant the target of the federal funds rate to remain at exceptionally low levels for an extended period. In turn, at the beginning of April the European Central Bank decided to increase its policy rate by 25 basis points, claiming higher risks to price stability in the medium term. Besides, central banks of other advanced economies, such as Canada, Sweden and Australia, have also increased their reference interest rate. The aforementioned has led to a depreciation of the USD with respect to the currencies of other advanced countries.
Higher inflationary pressures were observed in several emerging countries, which reflected both the commodity price increase and the fact that some economies are going through an advanced phase of their business cycle. Some of them even registered signs of overheating, hence their central banks increased their reference rates, which for many of these countries implied the continuation of the withdrawal of the significant monetary stimulus that they introduced.
In the international financial markets, the conflicts in the Middle East and North Africa, as well as the natural disasters in Japan, have had relatively limited effects so far. Global financial conditions registered an improvement since the end of 2010, with the exception of Europe, where the tensions, caused by the precarious fiscal situation in some of the countries in the region and the uncertainty about some banking systems’ soundness, persist. Therefore, a possibility of a new crisis is not ruled out.
During the first three months of the year, capital flows to emerging countries showed volatility. Nevertheless, starting from the end of March a recovery of these flows has been observed, and, in general, the appreciation trend of emerging economies’ currencies was intensified. An environment of lower risk aversion in the international financial markets contributed to this.
In Mexico, during the first quarter of 2011 the dynamism of the external demand continued to pass through to the components of domestic expenditure, which led to aggregate expenditure consolidating its positive trend and presenting a more balanced composition. Thus, productive activity and employment kept registering a positive trend. However, various indicators of the conditions prevailing in the markets of the main production factors, as well as an evaluation of the balance between economy’s income and expenditure, suggest that no generalized pressures on prices are observed.
In this sense, annual headline inflation significantly decreased during the first quarter of 2011, reaching 3.04 percent in March, while at the end of the previous quarter it was 4.40 percent. This performance was congruent with the forecast published by Banco de México in the last Inflation Report. Annual core inflation also continued exhibiting a downward trend. Essentially, this was influenced by the monetary policy conduction and by the absence of labor cost related pressures. Besides, the fading effects of various shocks presented last year and, notably, the exchange rate appreciation contributed to this result.
Thus, the reduction of headline inflation in Mexico, contrary to the development observed in most countries, was due to the fact that the impact of the international energy price increase had a bounded influence on domestic prices given the policy of increments applied in their determination, in addition to the previously mentioned elements. In this sense, it is noteworthy that non-core inflation performed better than expected, which could revert in the future.
Considering the above mentioned, Banco de México’s Board of Governors decided to maintain the target for the Overnight Interbank Interest Rate unchanged from January to April 2011. In any event, the Board of Governors will continue to monitor the performance of inflation expectations, output gap and, especially, grain and other commodity prices, as well as diverse inflation determinants that might signal unexpected and widespread pressures on prices.
Thus, if, according to the Board of Governors, this eventuality materializes, the Central Institute will adequately adjust the monetary policy stance in order to reach the convergence of inflation to its 3 percent permanent target.
2

2. Recent Developments of Inflation
2.1. Inflation
During the first quarter of 2011, annual headline inflation significantly decreased. At the end of this period it was 3.04 percent, 1.36 percentage points lower as compared to the figure of December 2010 (Table 1). This result was congruent with the one forecasted by Banco de México in the previous Inflation Report. Particularly, the forecast located annual average headline inflation in the analyzed quarter within an interval of 3 to 4 percent, and the result was 3.46 percent (Table 1 and Graph 1).

The monetary policy stance has been congruent with the convergence of inflation towards its target. The decline exhibited by headline inflation during the analyzed period was driven by various factors that resulted in lower growth rates of the CPI core and non-core components (Table 1). In this regard, the following elements stand out:
1. Fading of the effects associated with fiscal adjustments and with the increase in fares and public prices approved by different levels of the government that took effect at the beginning of 2010.1
2. The economy still restrained from making full use of its productive factors. In particular, this was reflected in the absence of inflationary pressures associated with the labor costs of production.
3. Appreciation and lower volatility of the exchange rate contributed to mitigating pressures on the price formation process in the economy.
4. Reduction in the growth rate of agricultural products’ price subindex. Annual core inflation, corresponding to the CPI basket that is subject to greater influence from the monetary policy, decreased during the analyzed period.
This occurred despite the changes in relative prices in the world economy that Mexico, like the rest of the economies, has to absorb. In particular, in the period of December 2010 to March 2011 this inflation indicator dropped from 3.58 to 3.21 percent.
The core component groups, whose prices slowed their growth rate, were the services and non-food merchandise. In contrast, in the case of foods, beverages and tobacco, their annual change rate increased. This, to a large extent, was a consequence of increments in the price of corn tortilla and cigarettes: the former, due to the growth in the international corn prices, and the
1
Details on the referred fiscal adjustments can be consulted in the Addendum to the Inflation Report, July
– September 2009.
5
latter, due to the increase authorized by the Congress in the Excise Tax (Impuesto Especial sobre Producción y Servicios, IEPS) on tobacco of 35 cents per cigarette.
When evaluating core inflation performance during the first quarter of 2011, it is clear that no widespread contagion of the increase in international grain prices to other prices was observed. Even if both cigarettes and corn tortilla were excluded from the core CPI basket, annual inflation of this component would have decreased by a greater proportion than the observed one, going from 3.42 to 2.76 percent in the period of December 2010 to March 2011 (Graph 2).

The annual change of the services price subindex dropped from 3.36 to 2.57 percent in the period of December 2010 to March 2011 (Graph 3a and Table 1). This resulted from lower growth rates shown by the three constituting groups (housing, education and remaining services, Table 1). This has been mainly influenced by the monetary policy stance and the beforementioned fading of the effects of the fiscal adjustments determined by the Congress last year, as well as by other factors, among which stand out the following: i) price decreases in different telecommunication services given an intensification of competition levels (Graph 3b); ii) in various cities in the north of Mexico, the situation of insecurity is apparently mitigating the price increase in the case of different services; and, iii) the effect on prices of certain tourist services associated with the change in the Easter holidays calendar, since this implied a relatively high base of comparison for the calculations of the annual change of March 2011.
On the other hand, the annual growth rate of the merchandise core subindex increased from 3.82 to 3.97 percent between the end of the fourth quarter of 2010 and the first quarter of 2011. This result, as stated before, is due to the performance of the foods, beverages and tobacco group, whose annual change increased from 4.35 to 5.55 percent. In contrast, the annual inflation of the remaining merchandise dropped from 3.38 to 2.75 percent (Graph 4a and Table 1). The last group’s performance has been influenced by the exchange rate parity appreciation (Graph 4b).
6

Regarding the non-core component, its contribution to headline inflation significantly diminished. In the period between the end of the fourth quarter of 2010 and the first quarter of 2011, annual non-core inflation dropped from 7.09 to 2.46 percent. Part of this reduction will surely be temporary, and it is expected to revert in the following months. This result was determined by two main elements:
a. A significant price reduction of diverse agricultural products associated with relatively favorable supply conditions, which are usually of short- lived effect. This group’s annual growth rate dropped from 6.96 to -1.69 percent in the period of December 2010 to March 2011 (Table 1 and Graph 5a).
b. Lower increments in fares approved by local governments, in relation to the same period last year. In this regard, stands out the reduction in the incidence of inflation of public transport, fares for water supply services and for vehicle procedures (Graph 5b). The annual change exhibited by this group between the end of 2010 and the first quarter of 2011 fell from 8.39 to 3.27 percent.
Besides, the non-core component evolution, unlike what happened in other countries, maintained relatively isolated from increases registered in international energy prices, this, due to the policy of increments that presently governs the determination of domestic gasoline and LP gas prices. In the same way, the ordinary electricity fares showed an average annual increment of 3.8 percent. Thus, in March 2011 the annual change in energy consumer prices was 5.96 percent, while in December 2010 it was 6.44 percent (Table 1). Graph 6 demonstrates the growing difference between domestic and foreign gasoline price quotes. This was also the case of other energy prices.

8

2.2. Producer Price Index
During the first quarter of 2011 the annual inflation of the Producer Price Index (PPI) of finished goods and services, excluding crude oil, declined. This indicator dropped from 3.70 to 3.42 percent in the period of December 2010 to March 2011, mainly influenced by the disinflation observed in the group of transport and communications (Graph 7a). Nevertheless, the fall was partially counteracted by a higher growth rate observed in the construction sector price subindex. The recent evolution of the PPI suggests that this indicator did not generate significant pressures on consumer prices (Graph 7b).
9

2.3. Wages
The recent development of the main wage indicators continued pointing to the absence of labor cost-related pressures on inflation, which, in turn, kept contributing to an increase in employment. Thus, the average nominal income growth of total economy’s workers was 2.2 percent in annual terms in the fourth quarter of 2010 (this figure was 2.9 percent in the previous quarter, Graph 8a).
The IMSS reference wage, the wage indicator of the formal sector, exhibited an annual average change of 4.1 percent during the first quarter of 2011 (3.8 percent during the fourth quarter of 2010, Graph 8b). The contractual wage increase negotiated by firms under federal jurisdiction was 4.5 percent (this figure equals the one observed in the same period last year, Graph 8c).2
The recent evolution of the wages, combined with the increments observed in the labor productivity of the economy, has implied a decrease in the unit labor costs (see Section 4). This has contributed to both limiting possible pressures on prices, and promoting job creation.
2 The IMSS reference wage considers the daily average earnings of IMSS-insured workers during a certain period and some fringe benefits (e.g., end-of-year bonuses, vacation bonuses and commissions).
Contractual wages, on the other hand, include only direct increases in the reference wage rate negotiated by workers of firms under federal jurisdiction that will be in effect for the following 12 months. It is noteworthy that the monthly composition of this indicator is based on information from firms that were engaged in wage settlements, usually during the same period of the year and, for this reason, it follows a seasonal pattern. As a result, when analyzing the reference wage it is preferable to compare successive time periods, while in the case of contractual wages the relevant comparison is interannual.
10
3. Economic and Financial Environment
3.1. International Environment
3.1.1. World Economic Activity
World economic recovery continued in the first quarter of 2011. However, apart from various risks that have increased uncertainty about the global economic prospects, the growth rate remains uneven among countries and regions. Advanced economies have expanded at a moderate pace, partly reflecting continuous weakness of their private demand. In turn, emerging economies have maintained a vigorous growth.
The world economy faces significant challenges both in the short and in the medium term. In the U.S., the gradual recovery of private demand has been accompanied by an improvement in the labor market. Nevertheless, the unemployment rate remains elevated, the same as households’ debt level, while the housing market and its prospects continue depressed. In this context, uncertainty persists about the sustainability of the U.S. economic recovery once the fiscal and monetary stimuli, adopted to boost it, are withdrawn. At the same time, the energy price increases caused a rebound of inflation. Also, the ratio of public debt to GDP has reached historically high levels of approximately 90 percent. In some countries of the Euro zone, fiscal problems and problems of solvency of the financial system persist. In turn, geopolitical tensions in the Middle East and North Africa, and the situation in Japan after the recent natural disasters that affected the country have contributed to greater economic uncertainty worldwide.
In the U.S., the pace of economic activity slowed down at the beginning of 2011 relative to the one observed in the last quarter of 2010. Thus, according to preliminary data, real GDP rose 1.8 percent at an annualized quarterly rate during the first quarter, which was below the rate of 3.1 percent registered in the previous quarter. This led to a reduction in the growth prospects for this year according to the economic analysts. Consumer spending increased at a lower rate than in the previous quarter, partly due to the gasoline price increase (Graph 9a), and, partly, to the fact that it also resented the effects of the slow net wealth recovery of households derived from the continuous fall in housing prices.
Furthermore, the expansion of non-residential investment moderated during the first quarter. Although expenditure on equipment and software increased its growth rate, spending on construction contracted sharply, affected by adverse weather conditions. In turn, residential investment remained depressed given the weakness of demand, in a context of a large inventory of houses on sale.
Net exports stopped to contribute positively to output growth, because imports registered a recovery. Finally, government spending contributed negatively to GDP growth, to a large extent, due to the decrease in federal spending on defense, as well as in state and local spending.
Industrial production registered some strengthening during the quarter, with a growth of 6.0 percent at an annualized quarterly rate (Graph 9b), which was above the increase of 3.2 percent observed in the previous quarter. Some timely indicators, such as the index of purchasing managers and manufacturing orders, 12 suggest that the expansion of this sector will continue. However, industrial production has still not recovered the level it reached before the recession.3
During the first months of the year, some signs of improvement in the labor market were observed. The non-farm payroll employment grew, on average, by 192 thousand positions a month from January to April, as compared to 97 thousand in the previous four-month period. Furthermore, the unemployment rate fell from 9.4 percent in December 2010 to 9 percent in April 2011. Nevertheless, this improvement partly reflected a decrease in the labor force participation rate, while the employment-population ratio has remained practically unchanged since the beginning of the recovery (Graph 9c). Although the proportion of the long-term unemployed (27 weeks or more) declined compared to that of the end of 2010, it remained at historically very high levels.

In the Euro zone, several indicators (the purchasing managers’ index, the confidence indicator of the economy and the industrial activity, among them) suggest that economic activity improved its performance in the first quarter of 2011 relative to the one observed at the end of 2010. In particular, the favorable performance of Germany’s economy, based on the strengthening of both domestic spending and exports, stands out. However, there are marked differences in the performance of this region’s countries. This reflects the impact of the fiscal consolidation processes and the concern about the elevated levels of public debt in some countries. The region’s activity continues resenting uncertainty provoked by the continuous deterioration of the credit profile of some of its members. In particular, difficulties in the negotiation of the financial rescue package for Portugal and doubts about the fiscal solvency of Greece have affected the region’s performance and prospects.4 In turn, this concern about
3 The level of industrial production is 7.0 percent lower than the one reached in December 2007.
4 For example, the comments of various European authorities in mid-April generated speculations about a possible restructuring of the sovereign debt of Greece in the short term.
13
fiscal sustainability in different countries of the region has fueled again uncertainty about the solvency of various financial institutions highly exposed to the countries, whose governments are characterized by very precarious public finances.
Japan’s economic recovery in the first two months of 2011 was interrupted by the effects of the earthquake and tsunami that occurred in March in this country. The authorities implemented a series of measures, described below, aimed at mitigating the effects of the natural disasters and reducing uncertainty.
The market expectation is that the consequences of the catastrophe will strongly affect Japan’s GDP growth during the first and second quarter of 2011, but that the output decrease will be temporary. Furthermore, global production chains are expected not to be affected in a significant way in the medium term and the reconstruction effort is expected to boost the country’s activity from the second half of 2011 onwards.
Emerging economies maintained a vigorous growth during the first quarter, supported by a strong domestic demand and favorable international liquidity conditions. Several of these economies are going through an advanced stage of their expansion cycle. Some of them even show signs of overheating. In the first quarter, China’s GDP expanded at an annual growth rate of 9.7 percent (9.8 percent in the previous quarter). In turn, industrial production in India and Brazil registered certain moderation in the expansion rate in the referred period, although it remains at historically high levels.
3.1.2. Commodity Prices
During the first months of 2011, international commodity prices continued exhibiting an ascending trajectory, started in the second part of 2010. In particular, the commodity price index published by the International Monetary Fund (IMF) accumulated an increase of 19.3 percent between January and April (Graph 10a). Energy prices registered the highest growth in the analyzed period (26.1 percent). In general, the commodity price increase was driven by the emerging economies’ dynamism and by the highly expansionist monetary policy of the main advanced economies. Besides, energy prices were affected by the decrease in oil production derived from the geopolitical instability in the Middle East and North Africa.
International prices of food commodities grew during the first four-month period of this year. Nevertheless, the increase in this period (8.1 percent) was lower than the one observed during the last third of 2010 (16.6 percent, Graph 10b). Within this group of commodities, the growth of 27.1 percent in the price of corn stands out. To a large extent, this is due to greater demand for this grain, for human consumption in China and for ethanol production in the U.S. In contrast, wheat prices showed a smaller increase (9.7 percent), because world production of this grain has recovered due to better weather conditions after last year’s adverse effects registered in Australia and Russia.
14

3.1.3. World Inflation Trends
Headline inflation and its short-term expectations rose in the main advanced economies, mainly as a result of commodity price increases. On the other hand, with a few exceptions, such as the United Kingdom, core inflation has remained low, due to the large amount of idle productive capacity and slack conditions in the labor market that prevailed in these countries. Even more, long- term inflation expectations have maintained relatively stable.
In the U.S., headline inflation grew from 1.5 percent last December to 2.7 percent in March (Graph 11a), to a large extent, due to a rapid increase in gasoline price. In turn, core inflation remained low, but registered certain acceleration, moving from 0.8 percent to 1.2 percent in the same period (Graph 11b). In the context of the moderate recovery of economic activity, and anticipating that the inflation increase, derived from higher prices of energy and other commodities, would be temporary, the U.S. Federal Reserve Bank has decided in its recent Monetary Policy Committee meetings to continue with the quantitative stimulus till June, as planned. This will be realized by completing its program of net purchase of Treasury securities (QE2) and through the reinvestment of principal payments from its securities portfolio. The Federal Reserve also stated in its press release of April 27 that it would regularly review the amount and the composition of its security holdings. It would also maintain the federal funds target rate within the present interval of 0 to ¼ percent, and it would continue assuming that economic conditions will probably warrant the federal funds rate to maintain at exceptionally low levels for an extended period.
15

The discussion about the future of the U.S. monetary policy has been influenced by the state of this country’s public finances. The increase in the deficit and public debt (due to cyclical effects, income decrease and growth of expenditure on the adopted stimulus measures), has come on top of the structural problems stemming from pension and medical assistance programs. All this has resulted in a deterioration of the medium-term fiscal sustainability outlook (Graph 12). Although the U.S. economic strength and its role as the issuer of the world’s reserve currency, which reduces its financing costs, make facing an insolvency problem unlikely, the international organizations and rating agencies have emphasized the risks that postponing the implementation of a credible fiscal consolidation strategy would imply in the medium term. 5,6
Due to the above mentioned, fiscal policy is not perceived to play an additional role in strengthening economic activity in the near future. On the contrary, the budget proposal for the fiscal year 2012 seeks to halve the deficit by 2013. Thus, if there are additional economic stimulus measures, monetary policy is expected to carry out most of them. In this sense, perhaps the most relevant aspect of the Federal Reserve decisions in the following months is for how long the abovementioned Central Institute will maintain the quantitative easing level that is expected to be reached in June, that is, when it will start reducing its total security holdings, and will stop reinvesting the resources from previous investments at maturity.
5 The rating agency S&P downgraded in April its outlook of the long-term rating of the U.S. sovereign debt from stable to negative.
6 See IMF Fiscal Monitor of April 2011.
15

In the Euro zone, the annual headline inflation rate also reflected the rapid growth in commodity prices. From December 2010 on, this indicator remained above the upper limit of 2 percent, and in March it reached 2.7 percent.
In turn, core inflation located at 1.3 percent in March, as compared to 1.0 percent at the end of the previous quarter. In this environment, at the beginning of April the European Central Bank (ECB) increased its policy rate by 25 basis points to 1.25 percent, after having maintained it at 1.0 percent during the last two years. The ECB based this measure on the presence of greater risks to price stability in the medium term, despite the financing problems of some members and the differences in growth among the region’s countries.
In Japan, annual consumer inflation remained unchanged at 0.0 percent since December 2010, after registering positive figures in October and November.
In turn, even though it remained negative, the annual change of the core subindex located at -0.1 percent in March, as compared to -0.4 percent in December. The Bank of Japan has maintained its policy rate close to zero and continued with its quantitative easing program, while having to face new challenges provoked by the critical situation due to the recent natural disasters. Thus, in March the Bank of Japan conducted extraordinary liquidity injections and increased its asset- purchase program, in an effort to stabilize the money market and facilitate the banking activity, in order to support reconstruction projects. In turn, the G7 authorities agreed to undertake a coordinated exchange rate intervention aiming to depreciate the currency of Japan.
Inflationary pressures partly driven by higher commodity prices were observed in various emerging economies, whose expansion phase of the economic cycle is in an advanced stage (Graph 13). In China, consumer inflation located at 5.4 percent in March, above the 4.6 percent observed in December. In India, wholesale prices increased at an annual rate of 9.0 percent in March, as compared to 9.4 percent in December. In the case of Brazil, inflation raised from 5.9 percent in December to 6.3 percent in March. In this environment, the monetary authorities of various emerging economies continued withdrawing the strong monetary stimulus, introduced in the context of the international financial crisis, and adopted other restrictive measures.
16

3.1.4. World Financial Markets
International financial market conditions improved during the first quarter. Nevertheless, tensions caused by doubts about the fiscal solvency of some of Europe’s economies and about their banking systems soundness persisted in the region. The impact on the international financial markets caused by the conflicts in the Middle East and North Africa, as well as the natural disasters occurred in Japan has not been significant.
With the purpose of safeguarding financial stability of the Euro zone, the European Union achieved significant progress in the efforts to strengthen the crisis management strategy, the coordination of its policies and its government structure during the first quarter of 2011. With regard to crisis management, the European authorities pledged to establish the effective lending capacity of the European Financial Stability Facility (EFSF) at EUR 440 billion. Besides, an effective financing capacity of EUR 500 billion was determined for the European Stability Mechanism (ESM), by means of various financing schemes.7 The decision of granting financial support under the ESM will require a unanimous approval of the European Union members, once an analysis, with the IMF
7 The ESM will come into force in June 2013 and will assume the role of the EFSF and of the European Financial Stabilization Mechanism (EFSM) as a provider of financial assistance to member countries of the European Union.
17
participation, of the debt level sustainability of the applicant country is carried out.
Furthermore, the European Union countries reaffirmed their intention of conducting stricter stress tests in order to evaluate the soundness of the important financial institutions of the region.8,9
Other elements incorporated in the crisis management strategy include: the insertion, from June 2013 on, of collective action clauses in the issuance of sovereign debt securities by the European Union countries and the assignation of preferential creditor status to the loans extended through the ESM.
On the other hand, the Euro zone authorities agreed to implement a closer supervision and make specific commitments every year in different areas, among which stand out the ones relative to pension and medical care schemes, and to fiscal frameworks and financial regulation frameworks. Besides, they supported the legislative proposals aimed at strengthening the Stability and Growth Pact, and their coordination through the so-called European Semester.10
Given the growing refinancing problems, at the beginning of March Portugal decided to apply for financial assistance from the European authorities and the IMF. In the first days of May the government of this country announced that it had reached an agreement with these entities as to the commitments it would assume in order to be eligible for financial assistance. The package amount is EUR 78 billion, of which EUR 26 billion will be extended by the IMF, and the remaining EUR 52 billion, by the European Union. Portugal committed itself to reducing its budget deficit to 3 percent of GDP by 2013, to implementing structural reforms to promote growth, and to strengthening its financial system. Nevertheless, volatility persists in the debt markets of some countries given a possibility of a new fiscal and/or banking crisis in the area. During the first quarter, the credit ratings of Spain, Portugal and Greece were downgraded by the rating agencies.11
The long-term interest rates in the main advanced economies showed an upward trend from mid-October 2010 on, as its economic recovery has been improving. However, starting from mid-February, given the dissemination of some economic indicators signaling a weaker recovery than expected, particularly in the U.S., the emergence of political instability in the Middle East and North Africa and the natural disasters in Japan, the long-term rates of the main advanced countries interrupted this upward trend (Graph 14a and Graph 14b).
8 The recently created European Banking Authority (EBA) established in March the criteria and scenarios for banks’ stress tests, which will be conducted before June 2011.
9 At the end of March, Ireland announced the results of the stress tests realized in its banks, which showed that for the capital requirements to remain above the required minimum, around EUR 24 billion additionally are needed.
10 The European Semester is a new governance structure approved last September, by means of which the authorities of the European Union and of the Euro zone will coordinate ex-ante their economic and budgetary policies, with the purpose of guaranteeing their consistency both with the Stability and Growth Pact and with the so-called Europe 2020 strategy.
11 The credit rating of Greece was downgraded once again on May 9, 2011.
18
19

As to the exchange market, the USD depreciated against the majority of currencies during the first quarter of 2011 and so far in the second (Graph 14c).
Although the geopolitical events in the Middle East and North Africa, as well as the natural disasters in Japan stimulated greater demand for U.S. assets, it was not sufficient to counteract the downward trend shown by the USD since mid-2010. The EUR appreciation accelerated due to the increase in the policy interest rate implemented in April by the ECB. Although the JPY lost value against the USD during this quarter, with the help of massive interventions for this purpose by G7 central banks, it registered pressures to appreciate due to the expected capital repatriation necessary to reconstruct its infrastructure. The securities markets in advanced countries demonstrated lower profits as compared to the previous quarters, but they were still significant.
During the first three months of the year, capital flows to emerging economies registered volatility. This occurred particularly due to the uncertainty given the events in the Middle East and North Africa, as well as in Japan, but also because of the concern about some of these economies’ overheating. Demand for the sovereign debt securities of these countries remained basically unchanged during the quarter, while equity investment experienced a sustained drop during most of the quarter (Graph 15a). The latter was reflected in the falls in the stock markets of several of these economies (with exceptions, such as China) (Graph 15b), as well as in the increment in their sovereign risk indicators.
Nevertheless, from the last week of March onwards, certain recovery of capital flows to emerging countries, and some portfolio adjustments, implying these flows’ rebalancing among countries, have been observed. And, in general, the appreciation trend of their currencies was intensified (Graph 15c). The environment of lower risk aversion in the international financial markets contributed to the aforesaid. In some cases the authorities even implemented additional measures to restrict capital flows or moderate their effects on their economies.12

3.2. Developments in the Mexican Economy
3.2.1. Economic Activity
During the first quarter of 2011, aggregate demand accelerated, reflecting both the dynamism of the external demand and a more widespread reactivation of the domestic expenditure components. As a result, aggregate expenditure has continued to show a favorable trend and presents a more balanced composition.
The most recent foreign trade indicators show that merchandise exports have maintained a substantial dynamism, especially those corresponding to the manufacturing sector. This evolution has spread through different categories of goods and is the result of higher exports to both the U.S. and the rest of the world (Graph 16).
12 For example, in Brazil at the beginning of 2011 a minimum reserve requirement of 60 percent was introduced on short USD positions held by local banks, on the sums that exceed the amount, either of USD 3 billion or of the value of their tier-one capital. Furthermore, the tax on financial operations (el impuesto sobre operaciones financieras, IOF) on the loans in foreign currency for terms up to two years, taken by local institutions, increased to 6 percent. In January in Korea, a 15-percent tax on government securities holdings of foreign investors was introduced. In January in Taiwan, the authorities increased the minimum reserve requirement on accounts in local currency, held by non-residents, to 90 percent of stocks exceeding the outstanding balance on December 30, 2010. Stocks lower than the levels of the end of 2010 were subject to a minimum reserve requirement of 25 percent. In March in Indonesia a limit of 30 percent of the capital for short-term loans in foreign currency, subscribed by the banks, was established again.
20
21

With regard to domestic demand, timely indicators of private consumption show that it continues registering a positive trend. In fact, for the period analyzed in this Inflation Report this aggregate is estimated to have reached levels similar to those observed before the global crisis (Graph 17a). In turn, investment has exhibited clearer signs of reactivation in recent months. However, it is still at levels below those observed before the crisis (Graph 17b).
The evolution of domestic expenditure reflects the fact that several of its determinants continue to show a recovery. In particular, the real wage bill of the formal sector of the economy has showed a significant increase, as a result of higher employment levels in this sector (Graph 18a). In turn, producers’ and consumers’ confidence indicators in general have also shown certain improvement, despite still locating below pre-crisis levels (Graph 18b). Workers’ remittances recovered in the recent months, although they still remain at levels below the ones registered up to mid-2007 (Graph 18c). Finally, commercial banks’ financing for consumption continued reactivating in the first months of 2011, though at a moderate pace (Graph 18d), while the banks’ financing to private non- financial firms continues growing at higher rates.
21
22

Derived from the aforementioned, productive activity continued registering a positive trend. In particular, during the last months the industrial activity accelerated (Graph 19a), as a result of a greater expansion pace of both the manufacturing and the construction sectors (Graph 19b). In turn, the upward trend presented by some services starting from mid-2009 has been spreading, following the reactivation in the domestic spending. Indeed, apart from the growth exhibited since the beginning of the recovery by services, primarily related to the external sector (such as commerce and transport), the growth of those services aimed at the domestic market (such as telephone service, business support services, education and financial services), has also shown a greater dynamism.
Thus, the most recent indicators suggest that in the first quarter of 2011 GDP would present an increase in quarterly seasonally adjusted terms of approximately 0.6 percent, thereby maintaining its positive trend registered since the second half of 2009 (Graph 20a). This would imply an annual GDP change in the first quarter of 2011 above 5.0 percent (4.6 percent in the fourth quarter of 2010; Graph 20b).


3.2.2. Financial Saving and Financing in Mexico
The available financial resources of the economy continued increasing. In the fourth quarter of 2010, the annual flow of financial resources (coming from sources) was 9.4 percent of GDP, slightly above the one observed in the previous quarter (Table 2). Thus, the annual flows registered in the last two quarters of 2010 have been the highest since this statistic is elaborated (the fourth quarter of 2002).
In the first quarter of 2011, financial saving of the economy continued showing a favorable performance, reflecting both a greater amount of resources coming from abroad and an increase in the domestic sources of financing (Graph 21a). The annual flow of this saving as percentage of GDP was one of the highest in the last decade. Non-residents’ financial saving was a reflection of favorable performance of the Mexican economy and its prospects, as well as the environment of global liquidity combined with the high interest rate spreads between Mexico and the U.S. (Graph 21b and c). The conflicts in the Middle East and North Africa, as well as the natural disasters in Japan had limited effects on the capital flows to Mexico.
In turn, residents’ financial saving demonstrated real growth rates above the ones registered in the previous quarter, particularly referring to voluntary saving, which, to a large extent, resulted from higher levels of economic activity (Graph 21b). Nevertheless, in the same way as in the fourth quarter of 2010, residents’ financial saving was influenced by the increase in medium- and long- term interest rates that occurred during most of the analyzed quarter, negatively affecting the assets’ valuation.
With regard to the use of financial resources, in the fourth quarter of 2010, in the same way as in previous periods, the public sector and the international reserve accumulation by Banco de México absorbed approximately two thirds of the available financial resources. The increase in the public sector borrowing requirements (PSBR) in 2010 was the result of implementing various stimulus programs in the economy to face the negative effects of the international financial crisis. Furthermore, in the first quarter of 2011 the important accumulation of international reserves has maintained, which has allowed strengthening of Mexico’s external position given the possibility of a renewed turbulence in the global financial markets.13 The use of financial resources by the private sector, in an environment characterized by a recovery in the economic activity, has maintained an upward trend, noting the increased flow of financing to households registered in the fourth quarter of 2010 (Table 2).
13 In the first quarter of 2011, the international reserve accumulation reached USD 9,112 million.
25
26

Graph 21

26
Total financing to the private non-financial business sector continued its recovery since mid-2010, showing positive real growth rates, after a period of contraction due to the international financial crisis. To a large extent, this responds to the increase in credit demand that occurred in an environment of better economic prospects.
During the first quarter of 2011, domestic financing to non-financial private firms kept growing, in real terms, at higher rates, reflecting a more favorable dynamism of the credit granted by commercial banks.14 The referred rate located at 9.0 percent in March, which is congruent with the phase of the business cycle the economy is going through, and suggests that this financing is supporting the economic activity recovery (Graph 22a and b). Furthermore, firms continued increasing their placement abroad. Based on the preliminary data on the issuances realized in March 2011, in the first quarter of 2011 new placements of a total of USD 3,534.1 million were realized in the international financial markets, while during the two previous quarters a total of USD 658.9 million of securities was issued abroad.
In March 2011, commercial banks’ performing credit for consumption maintained, for the fifth consecutive month, a greater rate of expansion (Graph 22c), as a result, among other factors, of the growing employment levels and of greater consumer confidence. In turn, the housing sector continued its positive growth (Graph 22c), while its delinquency rates remain at low levels and continue their downward trend.

14 Given that foreign direct financing statistics are obtained with a certain lag, some aspects regarding domestic financing, as well as foreign financing by means of securities issuance will be highlighted below.
27
28
4. Monetary Policy and Inflation Determinants
The monetary policy stance is aimed at achieving the convergence of inflation to its 3 percent target, and has therefore been fundamental for propitiating the reduction of inflation.
In particular, between January and April 2011, Banco de México’s Board of Governors maintained its Overnight Interbank Interest Rate at a level of 4.5 percent (Graph 23). This was in line with:
i. The recovery of productive activity, which has led the economy towards a more advanced phase of the economic cycle, still without generating pressures on prices.
ii. An appreciation and lower volatility of the exchange rate.
iii. The fact that increases in international commodity prices did not result in a generalized contamination of neither domestic prices, nor inflation expectations.
iv. The inflation expectations, which remain anchored within the variability interval of plus/minus one percentage point around the 3 percent permanent target, although being located above that level.

It is particularly relevant that, despite an environment of greater dynamism in the economic activity, analysts’ inflation expectations for different horizons have maintained relatively stable during the last months. With respect to the short-term inflation expectations, their average for the end of 2011, as reported by Banco de México’s survey, was located around 3.9 percent from
28
29
January to April 2011 (Graph 24).15 Regarding this, it should be noted that the average for the expectations of the core subindex has maintained close to 3.7 percent, so the implicit non-core inflation expectations remain approximately at 4.6 percent. For longer-term horizons, the average expectations for the end of 2012 remained close to 3.8 percent.16 In turn, the mean reported for the next 4-year average has remained at 3.6 percent and the average for the next 5 to 8-year period at 3.5 percent. This shows that the expectations for all time horizons are anchored within the variability interval of plus/minus one percentage point around the 3 percent permanent target (Graph 25a).
These results are congruent with those obtained from a statistical analysis of the evolution of the whole distribution of inflation expectations reported by economic analysts in Banco de México’s survey, and not only with the evolution of the average responses (Box 1).
Despite the favorable inflation behavior, especially the downward trend shown by its core component, inflation expectations remain above the 3 percent target. With regard to this, it is noteworthy that even when inflation of energy prices is lower than in other countries, it is considerably above the 3 percent level. This is one of the elements that have led to the fact that over time non-core inflation tends to be located above 3 percent, a factor influencing the level where headline inflation expectations are located.
Complementing the analysis of inflation expectations, break-even inflation and inflationary risk (difference between the nominal yield on 10-year bonds and the real yield of the same term indexed debt instruments), after having reached 4.3 percent in mid-January, recently reduced to levels close to 4.0 percent (Graph 25b). Considering that the inflationary risk premia is positive, this implies that long-term inflation expectations implicit in the referred instruments are located at levels clearly below 4.0 percent, in line with the information from surveys of economic analysts. 17,18
15 In the case of the Infosel survey of January 7, 2011, the average of the expectations for the end of 2011 was 3.90 percent, while the corresponding figure for the May 6, 2011 survey was 3.87 percent.
16 The average of inflation expectations reported in the Infosel survey of May 6, 2011 for the end of 2012 was 3.75 percent.
17 Because of their nature, these indicators tend to be affected by changes in the liquidity conditions
prevailing in the money market. Therefore, they should be interpreted carefully given the volatility
commonly observed in their behavior.
18 Based on a model for the term structure of interest rates (Cortés and Ramos-Francia [2008], “A
Macroeconomic Model of the Term Structure of Interest Rates in Mexico”, Working Paper 2008-10, Banco de México), which allows the risk premia to vary over time, it is estimated that between July 2001 and March 2011 the inflationary risk premium implicit in 10-year nominal interest rate bonds was, on average, around 42 basis points.
29


33


In order to assess the conditions determining the price setting in the economy, first, it is necessary to evaluate if economy’s aggregate expenditure currently constitutes or could become a factor of pressure in the foreseeable future; i.e., if the expenditure increase has led the economy to operate at levels consistent with the potential GDP. Besides, given that the latter concept is not
33
34
directly observable and, hence, needs to be estimated by statistical methods, the results obtained should be interpreted as subject to a certain degree of statistical uncertainty.
Taking these considerations into account, despite the fact that the output gap has been closing, at present it is not statistically different from zero; i.e., zero is contained within a 95 percent confidence interval around the gap estimations, which considers the uncertainty regarding its calculation (Graph 26). This would suggest that, presently, the levels at which the economy is operating do not generate pressures on prices.

The pace at which the output gap has been closing differs among the sectors producing internationally tradable goods and those producing non- tradable goods and services (Graph 27). In particular, in the second case, there still seems to be a negative gap, suggesting that this sector has not reached its productive potential yet, although this gap does not appear to be different from zero from a statistical viewpoint. On the other hand, in the tradable goods’ sector, greater dynamism of external demand has already led the output gap to be located around zero. Nevertheless, as will be seen later, other indicators suggest that relatively slack conditions persist in this sector.
In addition to the output gap analysis, it is important to study the conditions prevailing in the markets of main production inputs, which, to a large extent, determine the evolution of the gap. Indeed, an important channel for evaluating whether aggregate expenditure could lead to pressures on the general price level corresponds to a greater demand in the markets for main production factors. In turn, it is also relevant to carry out an analysis of economy’s income and expenditure balance, measured by the current account balance. Finally, given
34
35
that the first sector that started a recovery process was the manufacturing sector, it is considered convenient to study its current conditions.19

The analysis of the different input markets suggests that no widespread pressures on their prices, neither on the country’s external accounts, are observed, and they will possibly not be observed in the following months.
Moreover, the conditions, currently determining the manufacturing sector, both in terms of availability of skilled labor for production and the level of productive capacity utilization, are not the ones observed in an economy that is growing above its productive potential. In particular, the following stands out:
a) In line with the evolution of productive activity, increased formal employment levels have been registered in the labor market (Graph 28a). Nevertheless, several indicators suggest that sluggish conditions still persist. In particular, unemployment and underemployment rates remain at levels above those observed in 2008, before the onset of the global crisis (Graph 28b). In this environment, firms constituting the manufacturing sector do not seem to have faced problems of skilled labor availability in order to increase their production (Graph 28c).20
19 Since the North American Free Trade Agreement came into force, it has been observed in Mexico, with some exceptions, like in 2001, that in general the manufactures tend to lead in the economic cycle with respect to services.
20 In general, both in Mexico and in other countries, it would be expected that, as the business cycle
progresses, it is in the hiring of more skilled labor where tighter labor market conditions would start to be observed.
35
36
Labor market conditions have contributed to moderate wage increases. On the one hand, the average income level of the jobs generated during the economy’s recovery is lower than that of the jobs lost during the recession (Graph 28d). On the other hand, econometric exercises suggest that the observed wage increments have been lower than those historically presented in similar business cycle phases (Box 2).
b) The fact that the levels of installed productive capacity utilization are below pre-crisis levels has allowed the reactivation of production levels to be greater than that observed in employment. Thus, an important increase in workers’ average productivity level has been observed. This, together with remuneration evolution, has resulted in a decline in labor unit costs (Graph 29) and an increase in firms’ competitiveness. The aforementioned has favorably affected price behavior and has contributed to an increased creation of jobs.


36


39
c) In turn, although the seasonally adjusted utilized productive capacity in the manufacturing sector continues to increase, it is still at levels below the ones registered in the first months of 2008 and below the ones of similar phases of previous business cycles (Graph 30).
d) Commercial banks’ credit to the private sector continues expanding in line with the aggregate demand growth, suggesting that its evolution is supporting the recovery of economic activity. Nevertheless, the credit in Mexico is increasing from a very low base, in addition to the fact that country’s banking institutions are highly capitalized and very liquid. This means that there also seem to be widespread slack conditions in the Mexican credit market, so the extension of financing can accelerate without inducing increases in firms’ costs in the foreseeable future.
39

e) Even though the growth in the economic activity has been reflected in a recovery of imports (Graph 31a), the fact that the export growth rate is high implies that the trade balance would be positive in the reported quarter, after having observed moderate deficits in the three previous quarters. Thus, the non-oil current account deficit as a share of GDP has reached its lowest level in the last 30 years, indicating that the economy is far from a situation where absorption presents a risk of being too high (Graph 31b). In addition, the external accounts performance has also contributed to the exchange rate appreciation.

40
41
With respect to international commodity prices, during the analyzed quarter they maintained the upward trajectory which started in the second half of the previous year. In this period the increases registered by foreign energy prices stood out. Nevertheless, their impact on domestic prices was limited due to the policy of increments determining prices of gasoline, diesel and LP gas, although this also led to an increasing fiscal cost. On the other hand, international grain prices also increased, especially the prices corresponding to corn (more details in Section 3.1.2). This was mainly reflected by domestic prices of tortilla, but so far it has not affected other food items. In the future, it cannot be ruled out that commodity prices will continue increasing, given the high growth of emerging economies and the specific shocks affecting the supply of different commodities. Although, as mentioned before, the international commodity price shocks, so far, have not had a significant impact on the inflation evolution in Mexico, this could change during the next months.
The previous elements have been jointly reflected in the yield curve dynamics. On the one hand, the short-term interest rates remained without major changes during the first four months of the year, around 4.5 percent, in a context where the Overnight Interbank Interest Rate remained unchanged. In turn, during the first three months of the year, an increase in the longer-term interest rates was registered, leading to a steepening of the referred curve. In particular, the 30-year bond interest rate went from a level of 7.9 percent at the end of 2010 to a level of 8.6 percent in mid-March (Graph 32). It is important to note that this rise was not due to an increase in inflation expectations, but rather due to:
– An increase in the real component of interest rates, as reflection of the greater dynamism expected for the economic activity in Mexico.
– Although U.S. interest rates remain at reduced levels, during the first quarter and until mid-March they registered certain increases, also in line with the improved economic prospects that have been generating in that country.
Nevertheless, from mid-March until present, this steepening has reversed. Thus, the 30-year bond yield went from the before mentioned 8.6 percent to 8.1 percent during the last days. This has resulted from several aspects, among which stand out:
– Greater demand for Mexican Government’s debt instruments, in a context of increased search for yields in the international financial markets.
– Anchored domestic inflation expectations.
– From March onwards, a moderation in growth expectations in the U.S. as presented, negatively affecting its longer-term interest rates.

41
42
In the described context, during the first months of 2011, the nominal exchange rate continued showing an appreciation trend, moving from levels close to 12.4 MXN/USD at the end of December 2010 to a level of 11.6 MXN/USD recently. This has been the consequence of various factors:
a) Better economic growth outlook in Mexico.
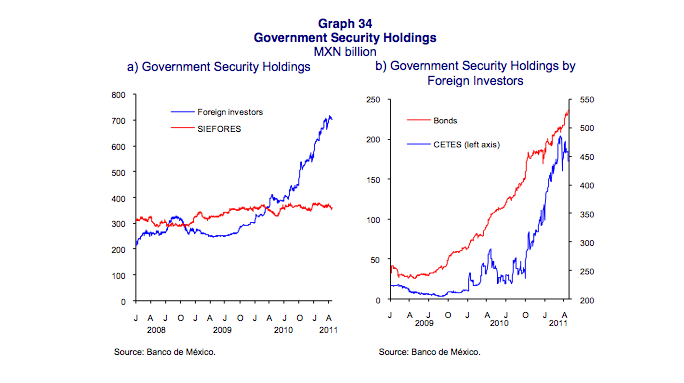
b) The extraordinary quantitative easing in the United States has implied elevated interest rate spreads between Mexico and the U.S. (Graph 33), which led to substantial foreign capital inflows, mainly channeled to government security purchases (Graph 34).
The high capital inflows to Mexico have considerably contributed to the exchange rate appreciation. Naturally, this has led to more stringent monetary conditions in Mexico, also favoring inflation evolution (Graph 35). Indeed, the reduced levels of U.S. interest rates have propitiated a relative tightening of monetary conditions in Mexico as compared to the economy with which it holds a high degree of trade and financial integration and which, in addition, issues the reserve currency. Thus, this monetary transmission channel has been fundamental for the reduction of inflation in Mexico.

42

44
1/ The Monetary Conditions Index (MCI or ICM for its Spanish acronym) is calculated as the weighted average of the changes in indicators of real interest rate and real exchange rate with respect to their average level during January 2000. The contribution weights of both indicators to the MCI are 0.5 and 0.5, respectively. The use of diverse analytical tools shows that these values are a good approximation to the contribution that the real interest rate and the real exchange rate have to the monetary conditions faced by the aggregate demand. An exchange rate appreciation and/or a real interest rate increase lead to an increase in the MCI. Therefore, an MCI increase suggests relatively more stringent monetary conditions.
2/ The weekly index of the bilateral real exchange rate with respect to the USD is calculated using the weekly average of the FIX exchange rate, the weekly average of the daily U.S. Consumer Price Index (linear interpolation of the CPI) and the weekly average of the daily Mexican CPI (linear interpolation of CPI). In turn, the weekly real interest rate is defined based on the weekly average of the nominal interest rate of the 28-day CETES and the inflation expectation for the next 12 months of the weekly Infosel survey.
Summing up, when analyzing the evolution of an important number of indicators providing information about the price and wage formation process in the economy, there is no evidence pointing to the existence of generalized inflationary pressures, although certainly there are risks ahead. Even though the output gap is closing rapidly, conditions in the factor markets are not characterized by a full employment situation, suggesting that there is still room for growth without accelerating inflation. On the other hand, monitoring is necessary, given the possibility of increased pressures resulting from commodity price behavior, the growing fiscal costs derived from gasoline subsidies, in addition to the fact that a reversal of capital flows cannot be ruled out, which could affect the exchange rate evolution.
44
45
5. Inflation Forecasts and Balance of Risks
The macroeconomic scenario presented below is based on the following considerations:
a) U.S. GDP showed lower growth in annualized quarterly terms in the period of January-March 2011 (1.8 percent) compared to the one registered in the last three months of 2010 (3.1 percent). In contrast, U.S. industrial production showed an expansion in annualized quarterly terms of 6.0 percent in the first quarter, which exceeded the growth of 3.2 percent in the period of October-December 2010.
b) Despite industrial dynamism registered in the United States, the slowdown of its domestic economy suggests a GDP growth in the following years slightly lower than the one forecasted in the Inflation Report, October – December 2010. In particular, growth rates of 2.7 and 3.2 percent are expected in 2011 and 2012, respectively (3.2 and 3.3 percent in the previous Inflation Report). In contrast, in the case of industrial production, increases of 5.0 and 4.2 percent are expected in 2011 and 2012, as compared to the figures of 4.4 and 4.1 percent for the same years presented in the previous Inflation Report.21 This upward revision in the industrial growth expectations for 2011 reflects to a large extent the results already observed in the first quarter of the year.
Growth of the Mexican Economy: In the short term, the boost coming from U.S. industrial production is expected to continue. In turn, various indicators suggest a strengthening of domestic demand in Mexico during the first quarter of 2011. Consequently, the recent evolution of the economy and of the expectations of its main determinants, suggest that in 2011 GDP growth in Mexico could be greater than the one forecasted in the previous Inflation Report. Consequently, the forecast interval is adjusted from one of 3.8 to 4.8, to one of 4 to 5 percent. In turn, for 2012 the forecast remains unchanged, with the growth forecasted to be between 3.8 to 4.8 percent (Graph 36a).22 It is estimated that in the remainder of 2011 and in the first months of 2012 the output gap will continue closing, but it will be statistically located around zero. This, together with the presented analysis of conditions prevailing in the input markets, implies that no generalized pressures on prices are expected (Graph 36b).
21 These expectations are based on the average forecast by economic analysts interviewed by Blue Chip in May 2011.
22 It should be noted that the Fan Chart for the annual output growth shows the probability of realization of these forecasts for the given time horizon. The darker shaded areas represent the projection more likely to occur. The bands of each side with the same color but with lighter tones accumulate in total 10 percent of probability, and so successively until adding up 90 percent of probability. The same technique is used in the case of output gap and inflation forecasting. For more details on the construction and interpretation of this kind of graphs see Box 3 “Fan Charts for Illustrating the Probability of Economic Variable Forecasts Realization” in the Inflation Report, July – September 2010. Thus, what the fan charts illustrate is the degree of uncertainty existing around the GDP and output gap forecasts for the period 2011-2012, presented in this section. For this reason, these graphs’ intervals differ from the ones presented in Graph 26 of Section 4 of the present Inflation Report, where the objective is to illustrate the degree of imprecision in the statistical estimation of the output gap levels for the period from January 2004 to February 2011.
45

46
Employment: Economic activity growth, as anticipated for 2011 and 2012, suggests the creation of between 600 and 700 thousand new formal jobs, in each of these two years, taking as a reference the number of IMSS-insured workers.
Current Account: It is expected that the gradual expansion of domestic demand will lead to a more widespread reactivation of imports. Therefore, in 2011 the trade balance and current account deficits are expected to be higher than those observed in 2010. Nevertheless, the observed dynamism of exports suggests that these deficits will remain at reduced levels. In particular, the trade balance is anticipated to register a deficit of USD 5.7 billion (0.5 percent of GDP), while the current account would present a deficit of USD 11.3 billion (1.0 percent of GDP). These figures are compared to the deficits registered in 2010 of USD 3.1 billion in the trade balance and of USD 5.7 billion in the current account. These forecasts are based on the assumption that the price of Mexican export crude oil will reach an average of USD 99 per barrel during 2011.
The liquidity conditions anticipated to prevail in international financial markets, the expectations of greater foreign direct investment flows, as compared to those of 2010, as well as the fact that the Mexican Government already pre-financed its external debt amortization program for 2011 and 2012, suggest a loose situation for the current account financing.
Diverse risks to the economic growth scenario prevail. In particular, although 2011 and 2012 are expected to be good years for the growth of the Mexican economy, greater risks to global growth begin to arise, especially in the medium term. These risks, if materialized, might affect aggregate expenditure growth in Mexico:
46
47
i. As already mentioned, uncertainty persists with respect to the sustainability of U.S. recovery. This could have implications on the speed at which the output gap closes in Mexico.
ii. The complicated political situation in some countries in the Middle East and North Africa has contributed to higher registered international oil prices.
iii. Global imbalances, after a cyclical correction, begin to expand again.
iv. Fiscal imbalances and the vulnerability of the banking systems, presented by some European economies, could generate episodes of instability in international financial markets.
v. The possible correction of the extremely lax monetary policy stance by the central banks of advanced economies or greater risk aversion of investors could induce a reversal of capital flows which have been directed to emerging economies. There is also a risk of an increase in interest rates at the global level, higher than currently expected, especially given the fiscal weakness in most of the advanced economies.
vi. At the national level, according to economic specialists surveyed by Banco de México, public insecurity and the absence of structural changes in the country continue being factors that could adversely affect the growth of the Mexican economy.
On several occasions Banco de México has reiterated how medium- and long-term growth has been affected by diverse institutional features that influence the allocation of productive resources. In this context, the deepening of the structural reform process is considered vitally important.
Inflation: The inflation forecast remains unchanged. Thus, it is considered that annual headline inflation will be congruent with the 3 percent inflation target during the next two years, considering a plus/minus one percent variability interval. In this regard, it is noteworthy that the forecast implies that during the whole horizon the most likely annual headline inflation trajectory will be between 3 and 4 percent (Graph 37).
The most likely trajectory of core inflation lies below the one expected for headline inflation, ranging between 3 and 3.5 percent during 2011 and slightly below 3 percent in 2012 (Graph 38).
The risks to which the world economy and, consequently, the economic activity in Mexico are subject to can clearly affect the Mexican inflation outlook. Also, the uncertainty surrounding the inflation forecast increases inasmuch as the forecast horizon extends. All this uncertainty is attempted to be captured by the fan chart for annual inflation (Graph 37). Regarding the upward risks that are considered to affect the expected inflation trajectory, stand out:
1. Potential increases in the prices of grains, in particular corn, and other commodities, which might influence the price formation process of diverse products. This turns out to be especially relevant since the
47
market structure prevailing in some industries raises the risk of producers trying to coordinate price increases. It should also be considered that in the medium term, if international energy prices remain high, such wide gaps between domestic and external prices are not sustainable.
2. The possibility that, given episodes of turbulence in international financial markets which can lead to the reallocation of portfolios and capital flows, pressures on the exchange rate would be reflected in price increases.
On the other hand, existing concerns regarding the possibility that the U.S. economy will maintain its dynamism, given the evident consequences on the performance of the Mexican economy, implies a downward risk to the expected inflation trajectory.

48

49
As stated before, the expected levels of the CPI non-core inflation component generate a difference in the headline and core inflation trajectories for the next two years. This is mainly associated with three elements: i) the policy of increments in energy prices aimed at reducing the existing gap between these and their international references, especially given the recent increase of the latter ones; ii) the expected revisions of different fares approved by local governments at a pace higher than the expected headline inflation; and, iii) during 2012, the group of fruit and vegetables is expected to make a greater contribution to inflation, given the biannual pattern presented by their prices. Banco de México has already mentioned on previous occasions that the misalignment between domestic and international energy prices entails significant fiscal and economic costs. For this reason, the policy of increments oriented at decreasing the abovementioned misalignment will allow the government to have sound public finances. This is an important element in order to maintain an environment of low inflation.
In this context and taking into consideration the elements pointed out in the Inflation Report, Banco de México will monitor the performance of inflation expectations, output gap and, especially, grain and other commodity prices, as well as diverse inflation determinants that might signal unexpected and widespread pressures on prices. Thus, if, according to the Board of Governors, this eventuality materializes, the Central Institute will adequately adjust the monetary policy stance in order to reach the convergence of inflation to the 3 percent permanent target.
49
Technical Chapter Exchange Rate Pass-through to Prices
This technical chapter addresses the topic of the effect of exchange rate fluctuations on prices of goods and services in Mexico. Based on several studies carried out at the General Economic Research Directorate (Dirección General de Investigación Económica), evidence is presented that the effect of exchange rate fluctuations on prices seems to have declined since the adoption of an inflation- targeting regime. This result is important, since for the design and conduction of monetary policy it is fundamental to know how fluctuations in the exchange rate parity affect inflation. In turn, it is also necessary to carefully analyze the interaction between exchange rate movements and inflation in order to establish whether the floating regime in Mexico facilitates the adjustment of the real exchange rate given external shocks.
1. Introduction
In 2001, Banco de México formally adopted an inflation-targeting regime. Under this scheme, an explicit inflation target is announced, as well as the institutional commitment to reach this target.23 In order to meet the announced goal, it is important for the Central Institute to identify the transmission mechanisms of monetary policy and to adequately respond to external or domestic shocks that affect the economy and, in particular, the price dynamics in Mexico.
In economies like the Mexican one, that in general are price takers in international markets, the exchange rate is one of the most important transmission mechanisms of monetary policy.24 In particular, nominal exchange rate fluctuations tend to affect domestic prices of goods and services through diverse channels, which is known in literature as exchange rate pass-through to prices. In general terms, first and second round effects of exchange rate movements on consumer prices can be distinguished. With respect to the first ones, two channels can be mentioned: direct and indirect. The direct channel is observed through an adjustment of the price of imported consumer goods. Also, prices of imported inputs and capital goods directly affect the cost structure of producers, which, in turn, at least partially, is passed on to final consumers. The indirect effect occurs through the mechanisms which influence aggregate domestic demand and which are transferred to final prices. In other words, an exchange rate depreciation will make imported goods more expensive with respect to domestic goods, which increases the demand for domestic goods, generating upward pressures on consumer prices.
Regarding the second round effects, the transmission channel depends on how inflation expectations are formed. In an environment of high and volatile inflation, and in particular if the monetary authority’s commitment to price stability is not credible, inflation expectations tend not to be well anchored. In this context,
23 A note on the inflation-targeting scheme is available at the following link:
http://www.banxico.org.mx/politica-monetaria-e-inflacion/material-de-referencia/intermedio/politica-
monetaria/%7B5C9B2F38-D20E-8988-479A-922AFEEBB783%7D.pdf
24 Except for large-scale economies, like the United States or China, the rest of the countries, that are
engaged in transactions at the global level, are considered as price takers in the international markets
and are usually known as “small open” economies, since their transactions do not affect international
prices of the products they trade.
50
51
given the consumer price increase associated with the first round effects mentioned before, economic agents expecting higher inflation might respond with upward price adjustments (including wages), thereby generating greater inflationary pressures. This last channel corresponds to the second round effects of the exchange rate movements on domestic price changes.
The pass-through of exchange parity changes is an important aspect in the monetary policy design. A high degree of pass-through can generate a depreciation-inflation spiral, affecting the inflation target (Obstfeld, 1982). In such case, the monetary policy would need to be coordinated with the exchange rate policy in order to reduce the impact of exchange rate fluctuations on inflation. On the other hand, if the pass-through degree is low, the Central Institute would have more freedom in conducting a monetary policy independent from exchange rate fluctuations, as well as in implementing an inflation-targeting scheme.25
An important determinant of the degree of pass-through is the inflation environment. Low and stable inflation, derived from a credible monetary policy, resulting in well anchored inflation expectations, tends to moderate the inclination of firms to pass through depreciation-related cost shocks to consumers. This basically occurs given the fact that in such an environment, with a credible monetary anchor, a depreciation is not always considered permanent, since exchange rate movements are also perceived to possibly go in the opposite direction. Under these circumstances, workers will also tend to moderate their demand for wage increments in an environment with a more depreciated exchange rate. Hence, when economic agents expect the monetary authority to act decisively in order to maintain inflation under control, they are less inclined to change prices in the case of depreciation. This occurs given that, in an environment of price stability and with a flexible exchange rate regime, agents tend to perceive exchange rate shocks as temporary. In this way, the pass- through can decrease under an adequate monetary policy.
This chapter demonstrates that there has been an important change in the pass-through of exchange rate movements to prices since the implementation of an inflation-targeting scheme. In order to do this, an empirical analysis is carried out for the years when the exchange rate in Mexico has floated freely. In particular, the analysis is presented for two different subsamples, before and after 2001, coinciding with the date when an inflation-targeting scheme came into force in Mexico (and with the fact that inflation changed from being an unstable to a stable process, as described in the Technical Chapter of the previous Inflation Report).26
25 Some studies addressing the topic of exchange rate pass-through to price movements for the Mexican case are: Conesa (1998), González (1998), Garcés (1999), Goldfajn and Ribeiro da Costa (2000), Hausmann et al. (2000), Santaella (2002), Schwartz et al. (2002) and Baqueiro et al. (2003).
26 In the Technical Chapter of the Inflation Report, October – December, 2010 it was shown that since the adoption of an inflation-targeting scheme by Banco de México, inflation has reached a low and stable level. In particular, evidence was presented that both the level of headline and core inflation have had diverse structural changes and that since the beginning of the century both are fluctuating around its lowest level since 1969, year when the CPI was first used for measuring inflation. The results also indicate that both inflations are no longer highly persistent processes, since they turned to be more stable processes around the year 2001. As explained in this chapter, inflation is said to be very persistent if the shocks affecting it have effects that last over time. On the other hand, if persistence is low, inflation tends to be more stable because it has a shorter memory of the disturbances affecting it and therefore, tends to return to its medium-term level.
51
52
First, the response of the Mexican Consumer Price Index (INPC for its Spanish acronym, CPI in the following) to exchange rate fluctuations is analyzed. Also, the pass-through of exchange rate fluctuations to different price indices along the distribution chain is studied, in particular, the responses of the price index of imports; of the main components of the Mexican Producer Price Index (INPP for its Spanish acronym): merchandise (“producer price for tradable goods”) and services (“producer price for non-tradable goods”) price index; as well as the responses of the main CPI components: price indices of merchandise and agricultural products (“consumer price for tradable goods”), services (“consumer price for non-tradable goods”) and administered and regulated goods. The proportion of goods affected by shocks can decrease along the distribution chain, implying a decline in the magnitude of price adjustment along this chain. For instance, the share of imported goods affected by exchange rate shocks could be higher than the proportion of affected consumer goods (Bachetta and van Wincoop, 2002). The effect of exchange rate changes on price fluctuations is estimated considering the inflation of tradable and non-tradable goods and services separately. This is due to the different effects that exchange rate movements have on inflation, once the difficulty of trading goods and services internationally is considered.
This chapter is organized as follows. The second section describes the historical relation in Mexico between inflation and nominal exchange rate changes as a first illustration of the pass-through of these changes on prices. The third section presents the results of a Vector Autoregressive (VAR) model on the pass- through of exchange rate movements to CPI movements, as well as to other price indices.27 The model uses a sample from January 1997 to December 2010, period when Mexico had a floating exchange rate regime.28 The last section presents some final remarks.
2. Relationship between Inflation and Nominal Exchange Rate Changes
In order to provide a broader perspective on analysis to be presented, it is useful to start by analyzing the historical relationship between exchange rate changes and inflation in Mexico. Therefore, Graph 39 shows the paths of inflation and nominal exchange rate depreciation from 1976 to March 2011. As can be seen, from 1976 to 2000 both were closely related. In fact, the correlation coefficient between these two series for the referred period was 0.81. The devaluations occurred in 1976-1977, 1982-1983, 1987-1988 and 1995 were accompanied by considerable increases in inflation. Since 2001, date coinciding with the adoption of an inflation-targeting scheme, the relation between inflation and depreciation starts to decline. In this graph it can also be observed that the depreciation in 2008-2009, compared to previous devaluations, did not have significant effects on inflation. Indeed, the correlation coefficient between inflation and nominal depreciation from 2001 to March 2011 was 0.40. This result suggests that the implementation of an inflation-targeting regime has contributed to
27 A VAR model is a system of equations where the variables are usually modeled as endogenous
variables, i.e., each one of them is written as a linear function of their own lagged values, as well as the
lagged values of all the other variables in the system plus a statistical error term.
28 The study period used in the VAR model starts in 1997 and not in 1995, when the free floating exchange rate regime came into force, since it is considered that the data from 1995 and, to a lesser extent, from 1996, might present different dynamics since it corresponds to a transition period between the crisis and the new equilibrium of the economy.
52
anchoring inflation expectations, thereby generating an environment of low and stable inflation, which, in turn, has favored an environment where exchange rate depreciations do not seem to have permanent effects on inflation.

53
One way of calculating the pass-through of exchange rate movements over time is by estimating a moving regression of the annual inflation rate on the annual depreciation rate of the exchange rate, a constant and a lag of inflation, using monthly data from 1995 to 2010 with four-year rolling windows; i.e., the first estimation is done using a subsample of the first four years (48 observations), while in the following estimations one observation (the first one) is removed and another observation is added at the end of window, so that the estimation window moves along the whole sample. In this case, the sample starts from the date when the free floating exchange rate regime came into force.
Graph 40 shows the regression coefficient corresponding to the annual depreciation rate since 1999, year when the first window ends, as well as 90 percent confidence intervals. It can be observed that the degree of pass-through, measured this way, seems to decline since the year 2003.29 This evidence is in line with the hypothesis of Taylor (2000), which indicates that in an environment of low and stable inflation, derived from an efficient and credible monetary policy, firms are less inclined to pass through cost shocks to consumers, expecting that monetary policy actions will pursue an explicit inflation target. In fact, it can be seen in the graph that in the environment of low and stable inflation that Mexico has had during recent years, the pass-through seems to have been particularly low, as indicated by the coefficient estimates which are close to zero in the most recent subsamples.
29 The graph shows the change until the year 2003 and not 2001, when an inflation-targeting regime was adopted. This is because, when using rolling windows, the change is detected after it occurs, since the windows, including this change, also include data previous to the date when the change occurred.
53

54
3. Estimating the Effect of Exchange Rate Shocks on Inflation
The previous exercise did not consider the interactions of the exchange rate and inflation with other macroeconomic variables, such as the economic activity or the interest rate. For this reason, in the following, a model that captures these and other interactions is estimated. At the same time, the model allows showing how exchange rate disturbances affect the general price level.
3.1 Model Description
The analysis presented in this chapter is based on a VAR model, which is a tool commonly used for estimating the pass-through of exchange rate movements to inflation.30 Unlike the exercise with rolling windows, presented in the previous section, the VAR allows analyzing the effect of the exchange rate shocks conditionally, i.e., controlling for other variables that could possibly affect
prices.

30 Some empirical studies that have used a model of this type to analyze this pass-through include Choudhri et al. (2005), Hahn (2003), McCarthy (2000) and Stulz (2007).
54
55

Indeed, in line with the results shown in this chapter, headline inflation seems to have turned from being a stochastic trend process to a stationary process around the year when an inflation-targeting regime was adopted in Mexico. It is possible that this has also changed the transmission mechanism
through which factors like the output gap, the exchange rate, as well as diverse costs, affect inflation: e.g., Gaytán and González-García (2008) and Sidaoui and Ramos-Francia (2008) present evidence with respect to the possible change in the transmission mechanisms of diverse shocks to inflation around the same year. The mechanism used for identifying exchange rate shocks is recursive.
The exchange rate is ordered before the prices, allowing the shocks in the first variable mentioned to be immediately passed on to the latter ones. It also implies that the monetary authority observes price shocks with a lag.34 Following Peersman and Smets (2001) and Kim and Roubini (2000), the IGAE is ordered first. This implies that the real activity reacts with one lag to interest rate shocks, while the exchange rate responds immediately to shocks in the IGAE and the
31 In this model the interest rate is used as a monetary policy instrument. Nevertheless, during the study period other instruments have been used. Between 1995 and 2008, Banco de México used a reserves requirement target usually denominated “Corto”. Starting from 2008, it officially adopted the use of the interest rate as a monetary policy instrument. However, since 2004, the Central Institute sent signals to the market about the desired interest rate level (Banco de México, 1996; 2007), in addition to the fact that the Central Institute implicitly had an interest rate target through the “Corto”.
32 Data for Mexico are obtained from Banco de México, U.S. data, from the Federal Reserve, and the international commodity price index, from the IMF. The import price indices are expressed in local currency. The exchange rate refers to the period’s average in order to settle liabilities denominated in foreign currency.
33 A more detailed description of the used VAR, as well as additional exercises carried out using this model, can be found in Capistrán et al. (2011).
34 This assumption has been used in other studies in order to identify monetary policy shocks, e.g., in Sims
and Zha (1998) and Kim and Roubini (2000).
55
56
interest rate. These assumptions allow recovering the series of exchange rate shocks.
Alternatively, results of disaggregated domestic prices are also presented. The vector of the endogenous variables used in the complete model is
the following:

The ordering of the variables in the model with nine variables implies that exchange rate shocks simultaneously affect the prices along the distribution chain, going from imports to the producer and, finally, to the consumer.35 It should be clarified that the use of this recursive VAR model for
identifying the exchange rate shock presents both advantages and disadvantages. Among the first mentioned, the VAR considers all variables that are usually included in small-scale macroeconomic models for price taking economies. In addition, the used ordering and the recursive approach have also been used in other studies at the international level in order to analyze the price dynamics given
diverse shocks. Among the disadvantages, it can be mentioned that the used VAR model does not consider possible long-term relationships among the variables, neither other structural changes that might have occurred in the used sample, nor other identification mechanisms of shocks, like those presented by a structural VAR or a VAR with restrictions derived from micro-based models. Nevertheless, it should be noted that the presented results are consistent with the ones obtained
from a VAR estimated with variables in levels, considering possible long-term relations among the variables. In the same way, by carrying out an analysis for subsamples, the disadvantage of not considering other possible structural changes is diminished.
3.2 Effects of Exchange Rate Movements on Inflation
Using the VAR model explained in the previous section, the pass- through of exchange rate movements to different prices is estimated using impulse response functions. The system is disturbed by a unitary exchange rate shock, representing a 1 percent depreciation of the exchange rate. Graph 41
shows the impulse response functions of the CPI, as well as the exchange rate itself to an exchange rate shock. The responses are presented for a 24-month horizon with 90 percent confidence intervals.36 Graph 41a shows the response of the exchange rate to a 1 percent depreciation. This is the shock that is used to analyze price dynamics. Although the exercise consists in observing the response of the different price indices to a one-time exchange rate shock, the model considers the dynamics of the exchange rate. Hence, in this graph it can be observed that the initial shock lasts
approximately 24 months until it disappears.
35 This ordering has been used by Choudhri et al. (op. cit.), Hahn (op. cit.) and McCarthy (op. cit.). The impulse response functions may be sensitive to the ordering used. Therefore, the sensitivity of the results to different orderings is examined, although the results are not presented here due to space limitations. Given the low contemporary correlation between the residuals of the used variables, the results are robust to different orderings.
36 In particular, the analytical method is used for estimating the standard errors of the impulse response functions. For details about the estimation, see Lütkepohl (1989).
56
Graph 41b shows the dynamics of the pass-through of exchange rate movements to CPI inflation. This graph corresponds to the impulse response function typically presented in studies that use VAR models. Nevertheless, to facilitate the interpretation, Graph 41c shows the effect in terms of elasticities. In this case, the vertical axis indicates the accumulated change in inflation given a 1
percent exchange rate depreciation. The accumulated responses of inflation can be interpreted as percentage changes in the price index given a 1 percent depreciation of the exchange rate, i.e., the pass-through elasticities.37 As can be seen, the pass-through elasticity is positive and statistically significant. In the long term, this elasticity is approximately 0.16.

57
It is noteworthy that, for firms an exchange rate depreciation acts as a cost shock, which is passed through to consumers depending on factors such as the market structure, the price elasticities of goods and services, as well as diverse nominal and real rigidities (such as, e.g., “menu costs”). In an economy which is a price taker in the international market, it is expected that, in general, there would be a complete pass-through of exchange rate fluctuations to tradable goods’ prices. When homogenous goods are traded in an integrated global market, the arbitrage eliminates the price spread expressed in a common currency. This means that the law of one price applies, and that a depreciation will imply an increase in domestic prices by the same amount in order to reestablish the ratio of relative prices, at least in the long term. Nevertheless, Dornbusch (1987) shows that in situations of imperfect competition or imperfect substitution between domestic and imported goods, the exchange rate pass-through can be incomplete. This is due to the fact that firms strategically change their price setting methods and households change their consumption patterns in order to increase
or reduce their demand for consumption goods.

57
3.3 Evidence of Change in the Pass-through of Exchange Rate Shocks to Prices
Using the same VAR model, this section presents evidence of a change in the pass-through of exchange rate fluctuations to price movements starting from June 2001. As mentioned before, in that year Banco de México adopted an inflation-targeting scheme, which has been a determining factor in reaching price stability. Now, as in an economy characterized by price stability, firms tend to perceive cost shocks associated with exchange rate fluctuations as temporary, they are less inclined to pass them on to consumers.38 This phenomenon is mainly due to the fact that, as already mentioned, agents expect monetary policy actions to pursue an explicit inflation target (Taylor, op. cit.). Hence, a lower
degree of exchange rate pass-through provides more freedom in following an independent monetary policy and facilitates the control of inflation.
Graphs 42a and 42b show the impulse response functions before and after 2001, respectively. As can be observed in the left graph, the pass-through elasticity is higher in the period before June 2001. Prior to the change in inflation persistence (documented in the previous Technical Chapter) around 63 percent of the depreciation was transferred to the price level in the long term. After the change in persistence, less than 3 percent of the nominal depreciation is passed through to prices in the long term, besides the fact that this response is statistically not significant.39 In other words, since 2001, exchange rate shocks seem to have lower effects on inflation.

58
38 This evidence is related to the fact that the monetary regime is an important determinant of the pass- through degree, as Choudhri and Hakura (2006) point out in an international analysis. In the same way, it is in line with the evidence reported by Gagnon and Ihrig (2004) and Bailliu and Fujii (2004), documenting a decline in the exchange rate pass-through on consumer prices in the majority of industrialized countries.
39 The response is statistically equal to zero at a 10 percent significance level, since the 90 percent
confidence intervals include zero. It is noteworthy that these intervals are quite wide, thus, after 24
months the pass-through elasticity could reach 0.09 for the sample starting in 2001.
The presented evidence about the change in the pass-through is in line with the hypothesis of Taylor (op. cit.), which indicates that low and stable inflation derived from an efficient and credible monetary policy dampens the inclination of firms to pass through cost shocks; i.e., the intensity of the pass-through of exchange rate movements is reduced to the extent to which inflation declines,
mainly because the firms have less power to determine their prices. When inflation is high, the change in the price of a good is caused, to a large extent, by the change in the general price level, and to a lesser extent by a change in the relative price. On the other hand, when inflation is low, the changes in the price of a good are mainly due to changes in the relative prices. In the same way, in
situations of high inflation, there is greater uncertainty regarding inflation expectations. Thus, it is more difficult to distinguish which part of the price changes is due to changes in the general price level and which is due to changes in the relative prices. In this case, for the firms it is easier to pass through
increments in the input prices to their sales prices.
This hypothesis suggests that once inflation is stabilized at low levels, the exchange rate pass-through weakens and the exchange rate fluctuations exert less pressure on inflation. So, the economy starts experiencing the benefits of a flexible exchange rate. Under this regime, interest rates are determined in such a way that price stability is reached, while the nominal exchange rate adjusts freely in order to make foreign accounts reach an equilibrium too. Once price stability is achieved, when the economy is affected by an adverse disturbance of the terms of trade, the necessary depreciation of the real exchange rate is reached much faster when the nominal exchange rate depreciates, as compared to waiting until the price level decreases, as would be the case under a fixed exchange rate regime. Finally, also the real sector is isolated from external disturbances. This is possibly what happened in Mexico in response to the international financial crisis at the end of 2008. Indeed, when the Mexican economy was affected by different adverse external shocks, the nominal exchange rate depreciated immediately, in a context where inflation was little affected, allowing the real exchange rate to
depreciate as well and the external accounts to adjust orderly.
3.4 Exchange Rate Pass-through on Prices along the Distribution Chain
In this section, the results of estimating the effects of exchange rate disturbances along the distribution chain are presented. The determination of prices is realized at three different levels: prices of imported goods, producer prices and consumer prices. At each of these levels, prices are affected by domestic supply and demand shocks, as well as external shocks. In the presence of price rigidities, there may be lags in the price adjustment, implying a decline in the speed of adjustment along the distribution chain (Blanchard, 1987).
Graph 43 shows the impulse response functions of different indices to an exchange rate shock along the distribution chain for the period after June 2001. It is observed that the pass-through to the prices of imports is the highest, with a pass-through elasticity approximately equal to one in the first period. This can be explained since this index contains tradable goods. After 14 months, the effect of the exchange rate on the imports prices is not significant.
59


60
61
The response of the producer merchandise price index is less than the responses of imports prices. The initial elasticity is 0.15, it reaches its maximum of 0.26 after 14 months, and it stops being significant after 13 months. The response of the producer service price index is not statistically significant. This is mainly due to the fact that this index is composed of non-tradable goods.
As indicated by the graphs, the degree of the pass-through decreases along the production chain, being statistically equal to zero in the case of consumer prices of tradable goods. The pass-through elasticity of exchange rate shocks to consumer prices of tradable goods is approximately 0.02 after 6 months and reaches 0.11 12 months after the shock, although it is not statistically significant. This result is consistent with other studies of the pass-through of exchange rate shocks at the international level, for example, McCarthy (2000) and Gagnon and Ihrig (2004). In the case of the price indices of non-tradable consumer goods and administered and regulated goods, as well as the index of producer prices of non-tradable goods (Graph 43c), the effects of the exchange rate are statistically not significant.
These results indicate that indeed the firms respond to exchange rate shocks, but that the degree of the response varies along the production chain. As described before, the pass-through is higher to imports prices, followed by producer prices, and finally consumer prices. This may be due to the lower fraction of goods affected by the corresponding shocks in the price indices in the last stages of the distribution chain; i.e., the proportion of tradable goods, which are more prone to external shocks, tends to decrease along the distribution chain.
The price indices incorporate different costs, such as transport or distribution costs (Burstein, et al., 2003), thus, the pass-through is decreasing along the production chain. The imports price index is the most affected because it includes tradable goods that are considered to be at the first stage of the production process. On the other hand, the consumer price index receives a lagged and lower impact since it presents the last stage of the distribution chain. For the production of consumer goods, imports and domestically produced goods are combined (Bacchetta and van Wincoop, 2002).
4. Final Remarks
In this chapter, the effects of exchange rate disturbances on prices in Mexico are analyzed empirically. In line with the literature and the experience of other countries, regarding the fact that price stability and effectiveness of monetary policy are important determinants of the magnitude of the exchange rate
pass-through, this chapter presents evidence that there is practically a complete pass-through to imports prices (expressed in national currency) in Mexico, but that this pass-through is decreasing along the production chain (it is lower for producer prices and still lower for consumer prices). It is also documented that the effect on tradable goods is greater than on non-tradable ones.
The presented results suggest that the magnitude of pass-through has decreased after 2001, date coinciding with the change in inflation persistence, documented in the Technical Chapter corresponding to the Inflation Report, October – December 2010, as well as with the date when an inflation-targeting scheme came into force. In this way, the evidence is consistent with the premise
that the monetary policy scheme that has permitted having a low and stable
61
inflation, as well as anchored inflation expectations (although still above the target established by the Central Bank), has also allowed consumer prices to be less affected by exchange rate fluctuations.
References
Baqueiro, A., A. Díaz de León, and A. Torres. (2003). “¿Temor a la Flotación o a la Inflación? La Importancia del Traspaso del Tipo de Cambio a los Precios,” Working Paper No. 2003-02, Banco de México.
Bacchetta, P. and E. van Wincoop, (2002). “Why Do Consumer Prices React Less Than Import Prices To Exchange Rates?,” Working Paper 9352, NBER.
Bailliu, J. and E. Fujii. (2004). “Exchange Rate Pass-Through and the Inflation Environment in Industrialized Countries: An Empirical Investigation,” Working Paper 21, Bank of Canada.
Banco de México. (1996). Informe sobre la Política Monetaria. September.
Banco de México. (2007). Inflation Report. July-September.
Banco de México. (2011). Inflation Report. October-December.
Blanchard, O. (1987). “Aggregate and Individual Price Adjustment,” Brookings Papers of Economic Activity, Vol. 1, pp. 57-122.
Burstein, A. T., J. C. Neves and S. Rebelo. (2003). “Distribution Costs and Real Exchange Rate Dynamics during Exchange-Rate-Based Stabilizations,” Journal of Monetary Economics, Vol. 50, pp. 1189-1214.
Capistrán, C., R. Ibarra and M. Ramos-Francia. (2011). “El Traspaso de Movimientos del Tipo de Cambio a Precios: Un Análisis para la Economía Mexicana,” Manuscript, Banco de México.
Choudhri, E. U., H. Faruqee, and D. S. Hakura, (2005). "Explaining the Exchange Rate Pass-Through in Different Prices," Journal of International Economics, Vol. 65, pp. 349-374.
Choudhri, E. U. and D. S. Hakura (2006). ”Exchange Rate Pass- through to Domestic Prices: Does the Inflationary Environment Matter?” Journal of International Money and Finance, Vol. 25, pp. 614-639.
Conesa, A. (1998). “Pass-Through del Tipo de Cambio y del Salario: Teoría y Evidencia para la Industria Manufacturera en México,” Working Paper 9803, Banco de México.
Dornbusch, R. (1987). “Exchange Rates and Prices,” American Economic Review, Vol. 77, pp. 93-106.
62
Gagnon, J. E., and J. Ihrig (2004). “Monetary Policy and Exchange Rate Pass-Through,” International Journal of Finance and Economics, Vol. 9, pp. 315-338.
Garcés, D. (1999). “Determinación del Nivel de Precios y la Dinámica Inflacionaria en México,” Working Paper No. 1999-07, Banco de México.
Gaytán, A. and J. González-García. (2008). “Cambios Estructurales en el Mecanismo de Transmisión de la Política Monetaria en México: Un Enfoque VAR No Lineal,” Monetaria, Vol. 30, pp. 367-404.
Goldfajn, I. and S. Ribeiro da Costa. (2000). “The Pass-through from Depreciation to Inflation: a Panel Study,” Working Paper Series, No. 5, Banco Central de Brasil.
González, J. A. (1998). “Regímenes Comerciales y el Traspaso del Tipo de Cambio: ¿Hay un Enigma Mexicano?,” El Trimestre Economico, Vol. 65, pp. 49-97.
Hahn, E. (2003). “Pass-through of External Shocks to Euro Area Inflation,” Working Paper 243, European Central Bank.
Hausmann, R., U. Panizza, and E. Stein (2000). “Why do Countries Float the Way they Float?,” Working Paper No. 418, Research Department, Inter- American Development Bank.
Kim, S. and N. Roubini. (2000). “Exchange Rate Anomalies in the Industrial Countries: A Solution with a Structural VAR Approach,” Journal of Monetary Economics, Vol. 45, pp. 561-586.
Lütkepohl, H. (1989). “A Note on the Asymptotic Distribution of Estimated VAR Models with Orthogonal Residuals,” Journal of Econometrics, Vol. 42, pp. 371-376.
McCarthy, J. (2000). “Pass-through of Exchange Rates and Import Prices to Domestic Inflation in some Industrialized Economies,” Staff Reports 111, Federal Reserve Bank of New York.
Noriega, A. E. and M. Ramos-Francia. (2009). “On the Dynamics of Inflation Persistence Around the World,” Working Paper No. 2009-02, Banco de México.
Obstfeld, M. (1982), “Aggregate Spending and the Terms of Trade: Is there a Laursen-Metzler Effect?,” Quarterly Journal of Economics, Vol. 97, pp. 251-270.
Peersman, G. and F. Smets. (2001). “The Monetary Transmission Mechanism in the Euro Area: More Evidence from VAR Analysis,” Working Paper 91, European Central Bank.
Santaella, J. (2002). “El Traspaso Inflacionario del Tipo de Cambio, la Paridad del Poder de Compra y Anexas: la Experiencia Mexicana,” en La Inflación en México, Gaceta de Economía, ITAM.
63
Schwartz M. J., A. Tijerina and L. Torre. (2002) “Salarios, Tipo de Cambio y Dinámica Inflacionaria en México: 1995-2002,” Gaceta de Economía, ITAM, pp. 71-101.
Sidaoui, J. and M. Ramos-Francia. (2008). “The Monetary Transmission Mechanism in Mexico: Recent Developments,” BIS Papers, in: Bank for International Settlements (ed.), Transmission Mechanisms for Monetary Policy in Emerging Market Economies, No. 35, pp. 363-394.
Sims, C. A. and T. A. Zha. (1998). “Does Monetary Policy Generate Recessions?,” Working Paper 98-12, Federal Reserve Bank of Atlanta.
Stulz, J. (2007). “Exchange Rate Pass-through in Switzerland: Evidence from Vector Autorregressions,” Swiss National Bank Economic Studies No.4.
Taylor, J. B. (2000). “Low inflation, Pass-through, and the Pricing Power of Firms,” European Economic Review, Vol. 44, pp. 1389-1408.
64 end